Shop Manager includes a large variety of reports, in two main categories:
Common – a collection of common shop reports
My Reports – reports that you customize and save
All Reports – a categorical listing of all the reports available in Shop Manager
In addition to the help articles, you can view detail walkthroughs of report customization, charts, and security in these webinar segments:
Part 2: Customizing Reports and Charts
Part 3: Report Security and Q&A
The sections below give brief explanations of the content that is found in these webinars, along with links to the corresponding help articles. You can find more information and detail guidance in the Reports and Advanced Report Features articles.
These are the basic steps for customizing a report:
Click the Reports button in the Home ribbon.
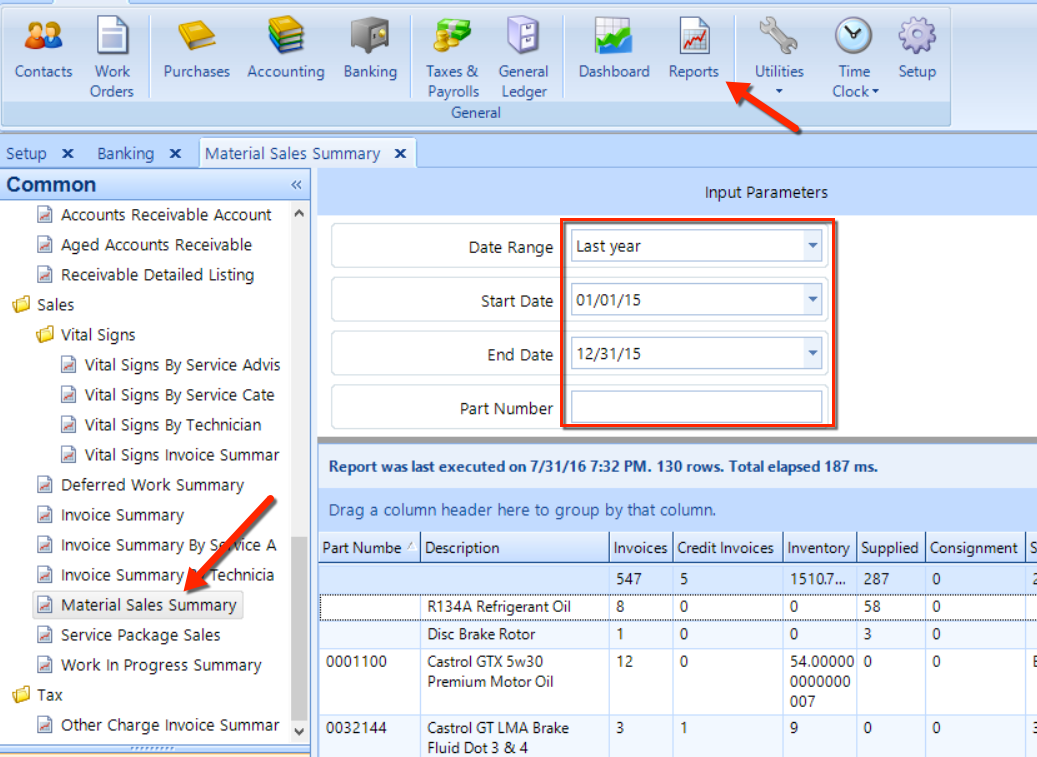
In the Common panel on the left side of the screen, locate a report and double-click it. For example, double-click Common > Sales > Material Sales Summary. See the figure below.
Choose a Date Range, or choose a Start Date and End Date.
Optionally, enter information in the other fields in the Input Parameters panel. For the Material Sales Summary report, you can also enter a Part Number as another search parameter.
Click on the Execute button in the ribbon. Any matching results will appear in the listing, much like is shown in the figure below.
You can remove columns to simplify a report. Click the Column Chooser button in the ribbon to display the choose pop-up, then uncheck the boxes of the columns that you want to remove (see the figure below).
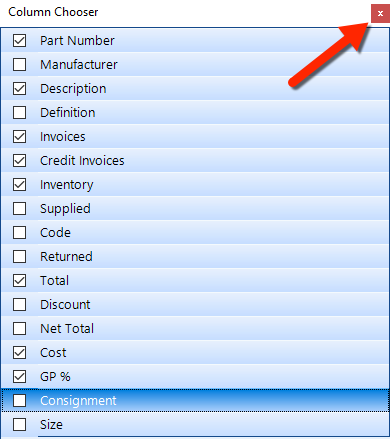
After confirming that the Column Chooser reflects your choices, click the small X button in the upper right corner to close the pop-up.
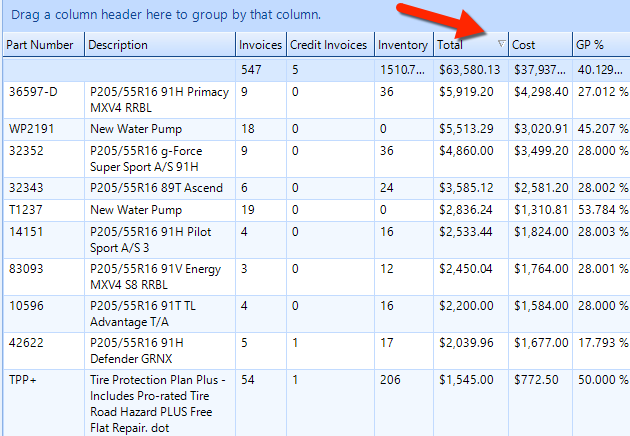
Sort on any column of data by clicking on it. Click the column again to reverse the sort on that column.
Here we see a reverse sort on the Total column, which lists the highest values at the top:
You can also group the rows of a report on one or more columns.
To illustrate, let's continue with the Materials Sales Summary report example from previous sections:
First, use the Column Chooser to add the Manufacturer column back onto the report.
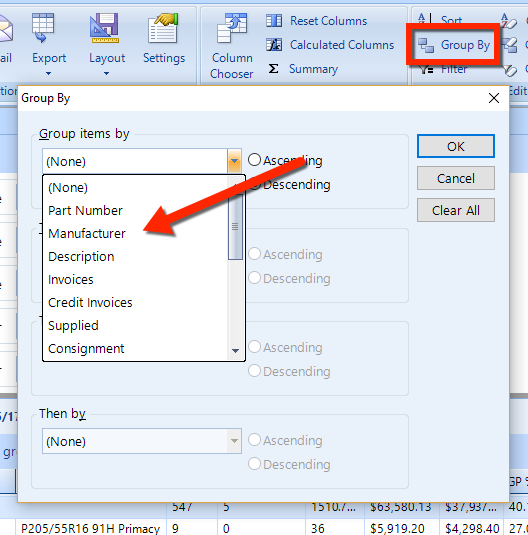
Click the Group By button in the ribbon.
Choose Manufacturer from the first column drop-down (see the figure below), and then click OK.
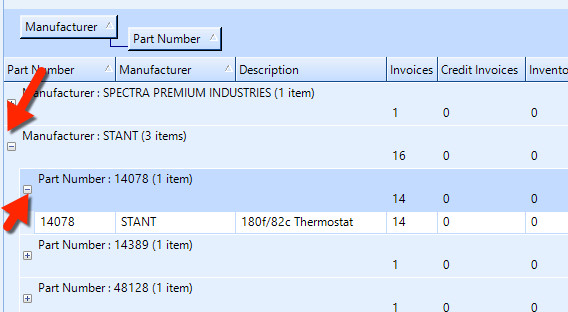
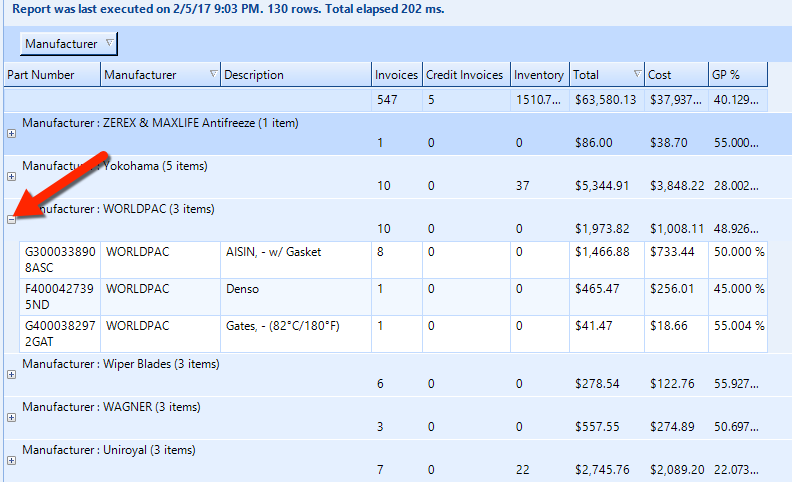
The report will change slightly in appearance to hide individual items that belong to the same value in the grouped column. As shown in the figure below, we have a grouping by Manufacturer. You can click one of the small + buttons to reveal the items that roll up under a particular manufacturer.
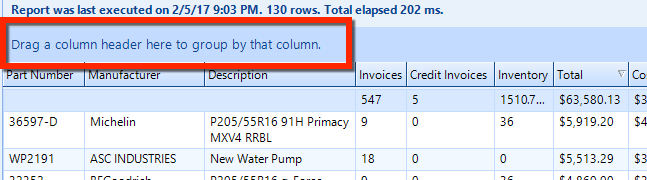
You can also group on one or more columns by drag-and-drop a column heading into the area immediately above the headings (see the figure):
You can add additional columns to the grouping. For example, you could drag both the Manufacturer and Part Number columns into the grouping bar (as shown in the previous section).